Establishing UX Research Infrastructure Across 6 Products
TL;DR
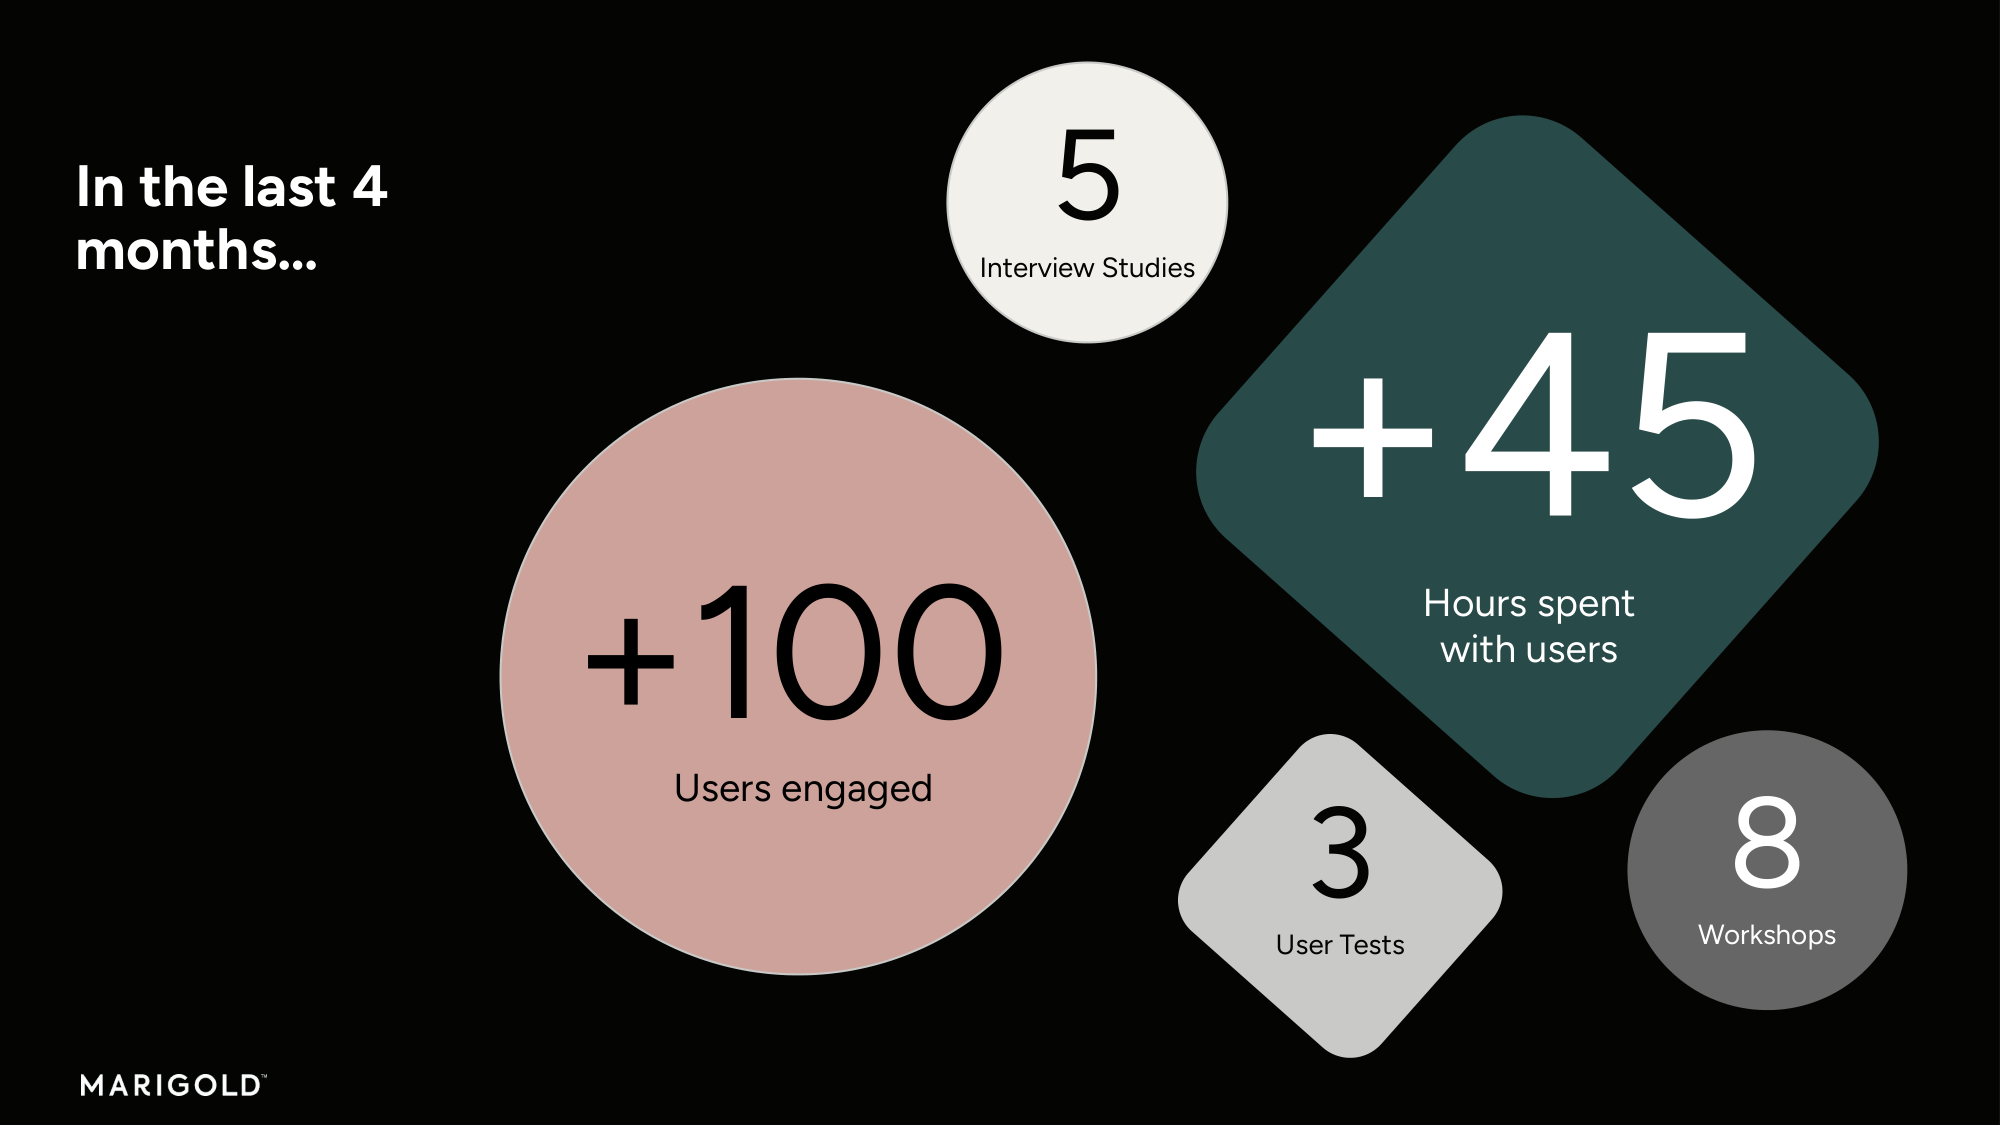
Marigold had six enterprise products and no shared research practice. I built the infrastructure: UX Foundations for five products, a research portal, methodology guides, standardized intake and briefing processes. The Loyalty Foundation redirected a product roadmap. Two rounds of usability testing on Sailthru Folders achieved a SUS score of 90. A success criteria evaluation on Liveclicker prevented a premature launch. All of the initial hands-on research, over 100 users and 45 hours, was conducted in four months as a stress test of the system. Which is now used independently by all 6 designers and 15+ product managers across the org.
Context
Marigold is a multi-product marketing technology platform serving enterprise clients. The portfolio spans email marketing (Sailthru, Selligent, Cheetah Digital), real-time content personalization (Liveclicker), interactive experiences for collecting zero-party data such as product pickers, giveaways, quizzes, and games (Grow), and loyalty program management (Loyalty).
I was hired in February 2025 as a Senior Product Designer, initially working on Liveclicker and Sailthru. By March I was responsible for design across all six products alongside the other UX designers on the team.
The Problem
There was no standardized way to do research. No shared methodology, no templates, no central place to store findings. Each product team operated in its own silo, making design decisions based on anecdote or engineering tickets rather than evidence. There was no systematic connection between the teams who talked to users every day, like Solutions Consultants and Training, and the teams making product decisions.
The products themselves had never been systematically evaluated from a UX perspective. Nobody had a clear picture of where users were struggling, what baseline usability looked like, or where the biggest opportunities were.
My Role
Senior Product Designer responsible for design across the product portfolio, working alongside other UX designers and reporting to the UX Senior Director. I identified the research infrastructure gap early and built the practice while simultaneously doing hands-on research across multiple products.
What I Built
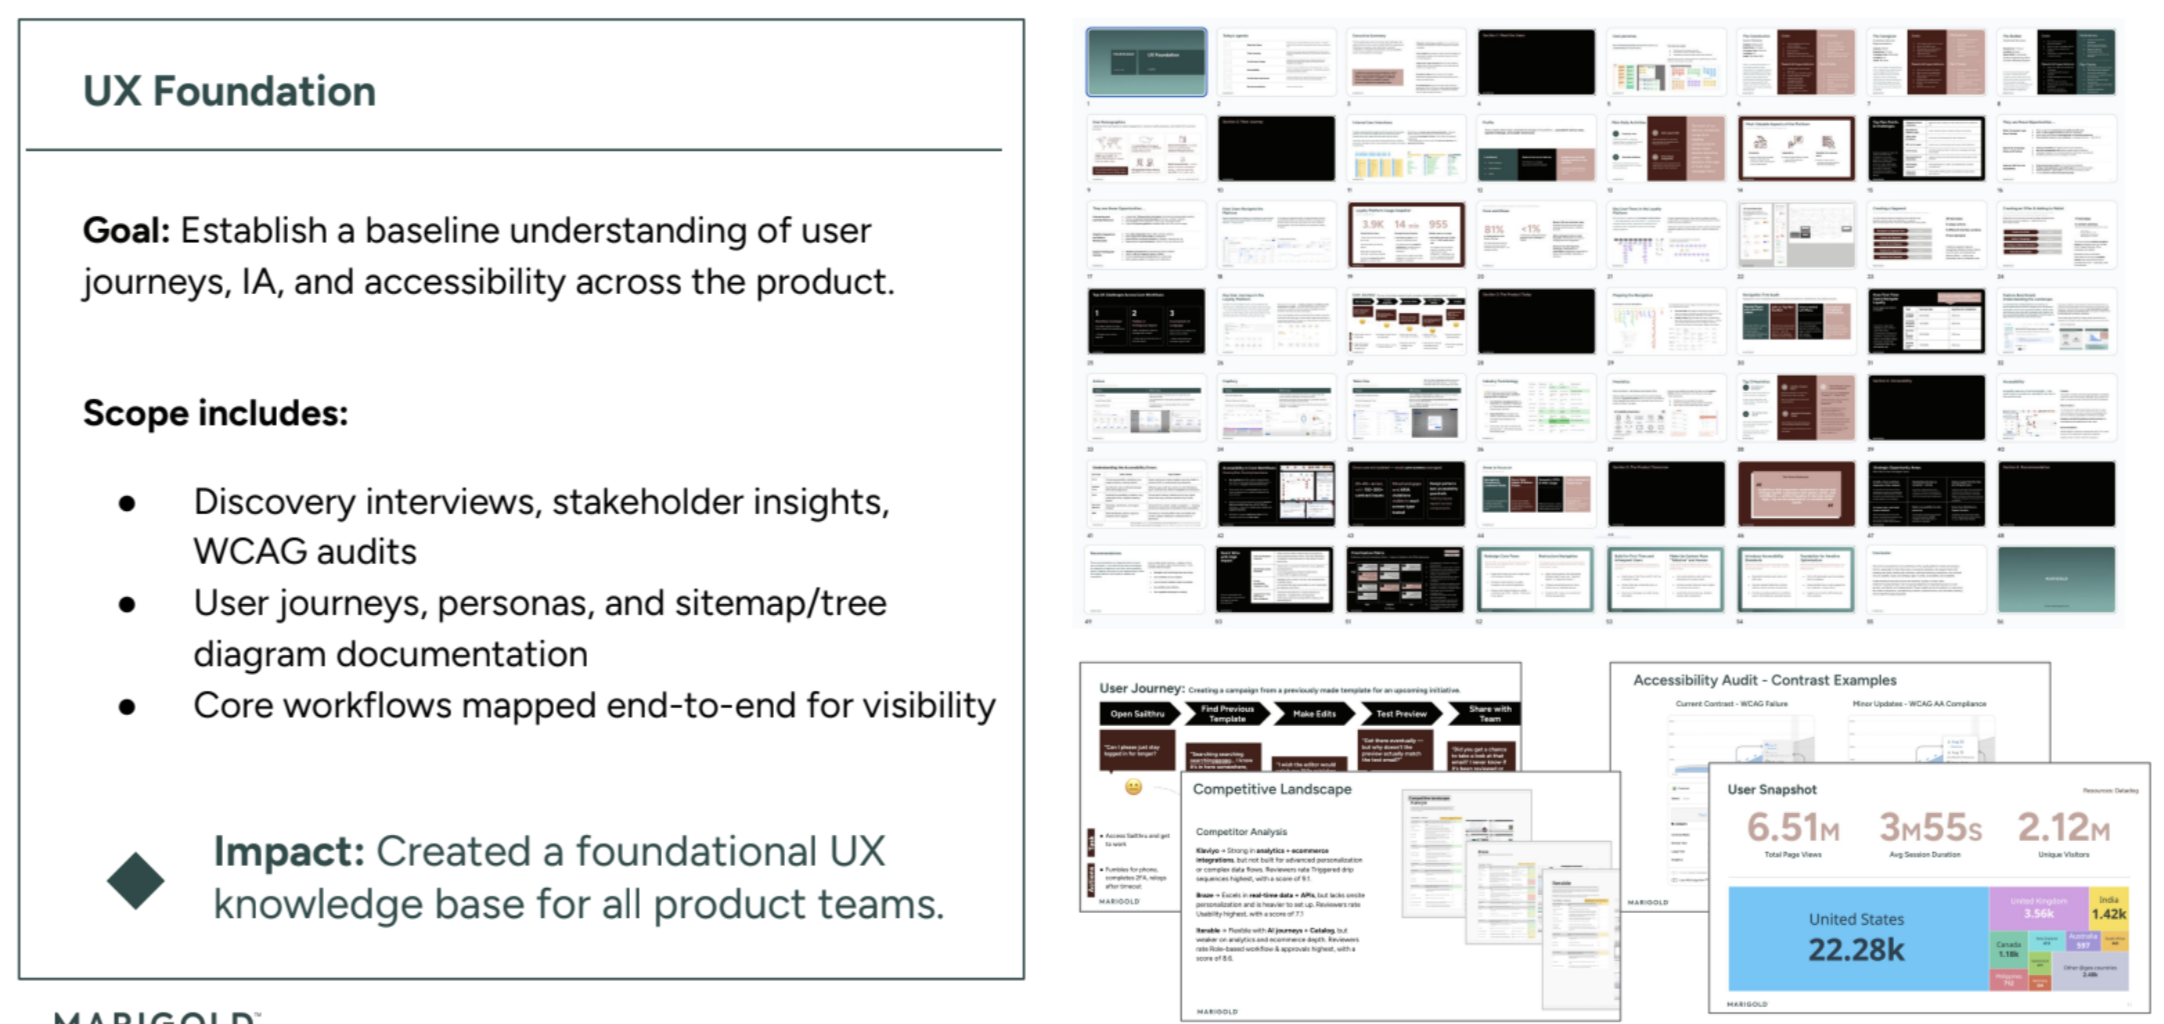
I started with something I called UX Foundations: a comprehensive baseline assessment for each product combining analytics (Amplitude, Datadog), user interviews, personas, journey maps, site navigation audits, heuristic evaluations, usability testing, competitor benchmarks, and accessibility scans. The goal was to produce a document that anyone could pick up and understand what we know about a product today from a UX standpoint, where the pain points are, and where the opportunities lie. I completed Foundations for five of the six products. Cheetah Digital was later deprecated, so we skipped it.
Around the Foundations I built the organizational scaffolding to make research sustainable beyond my own capacity:
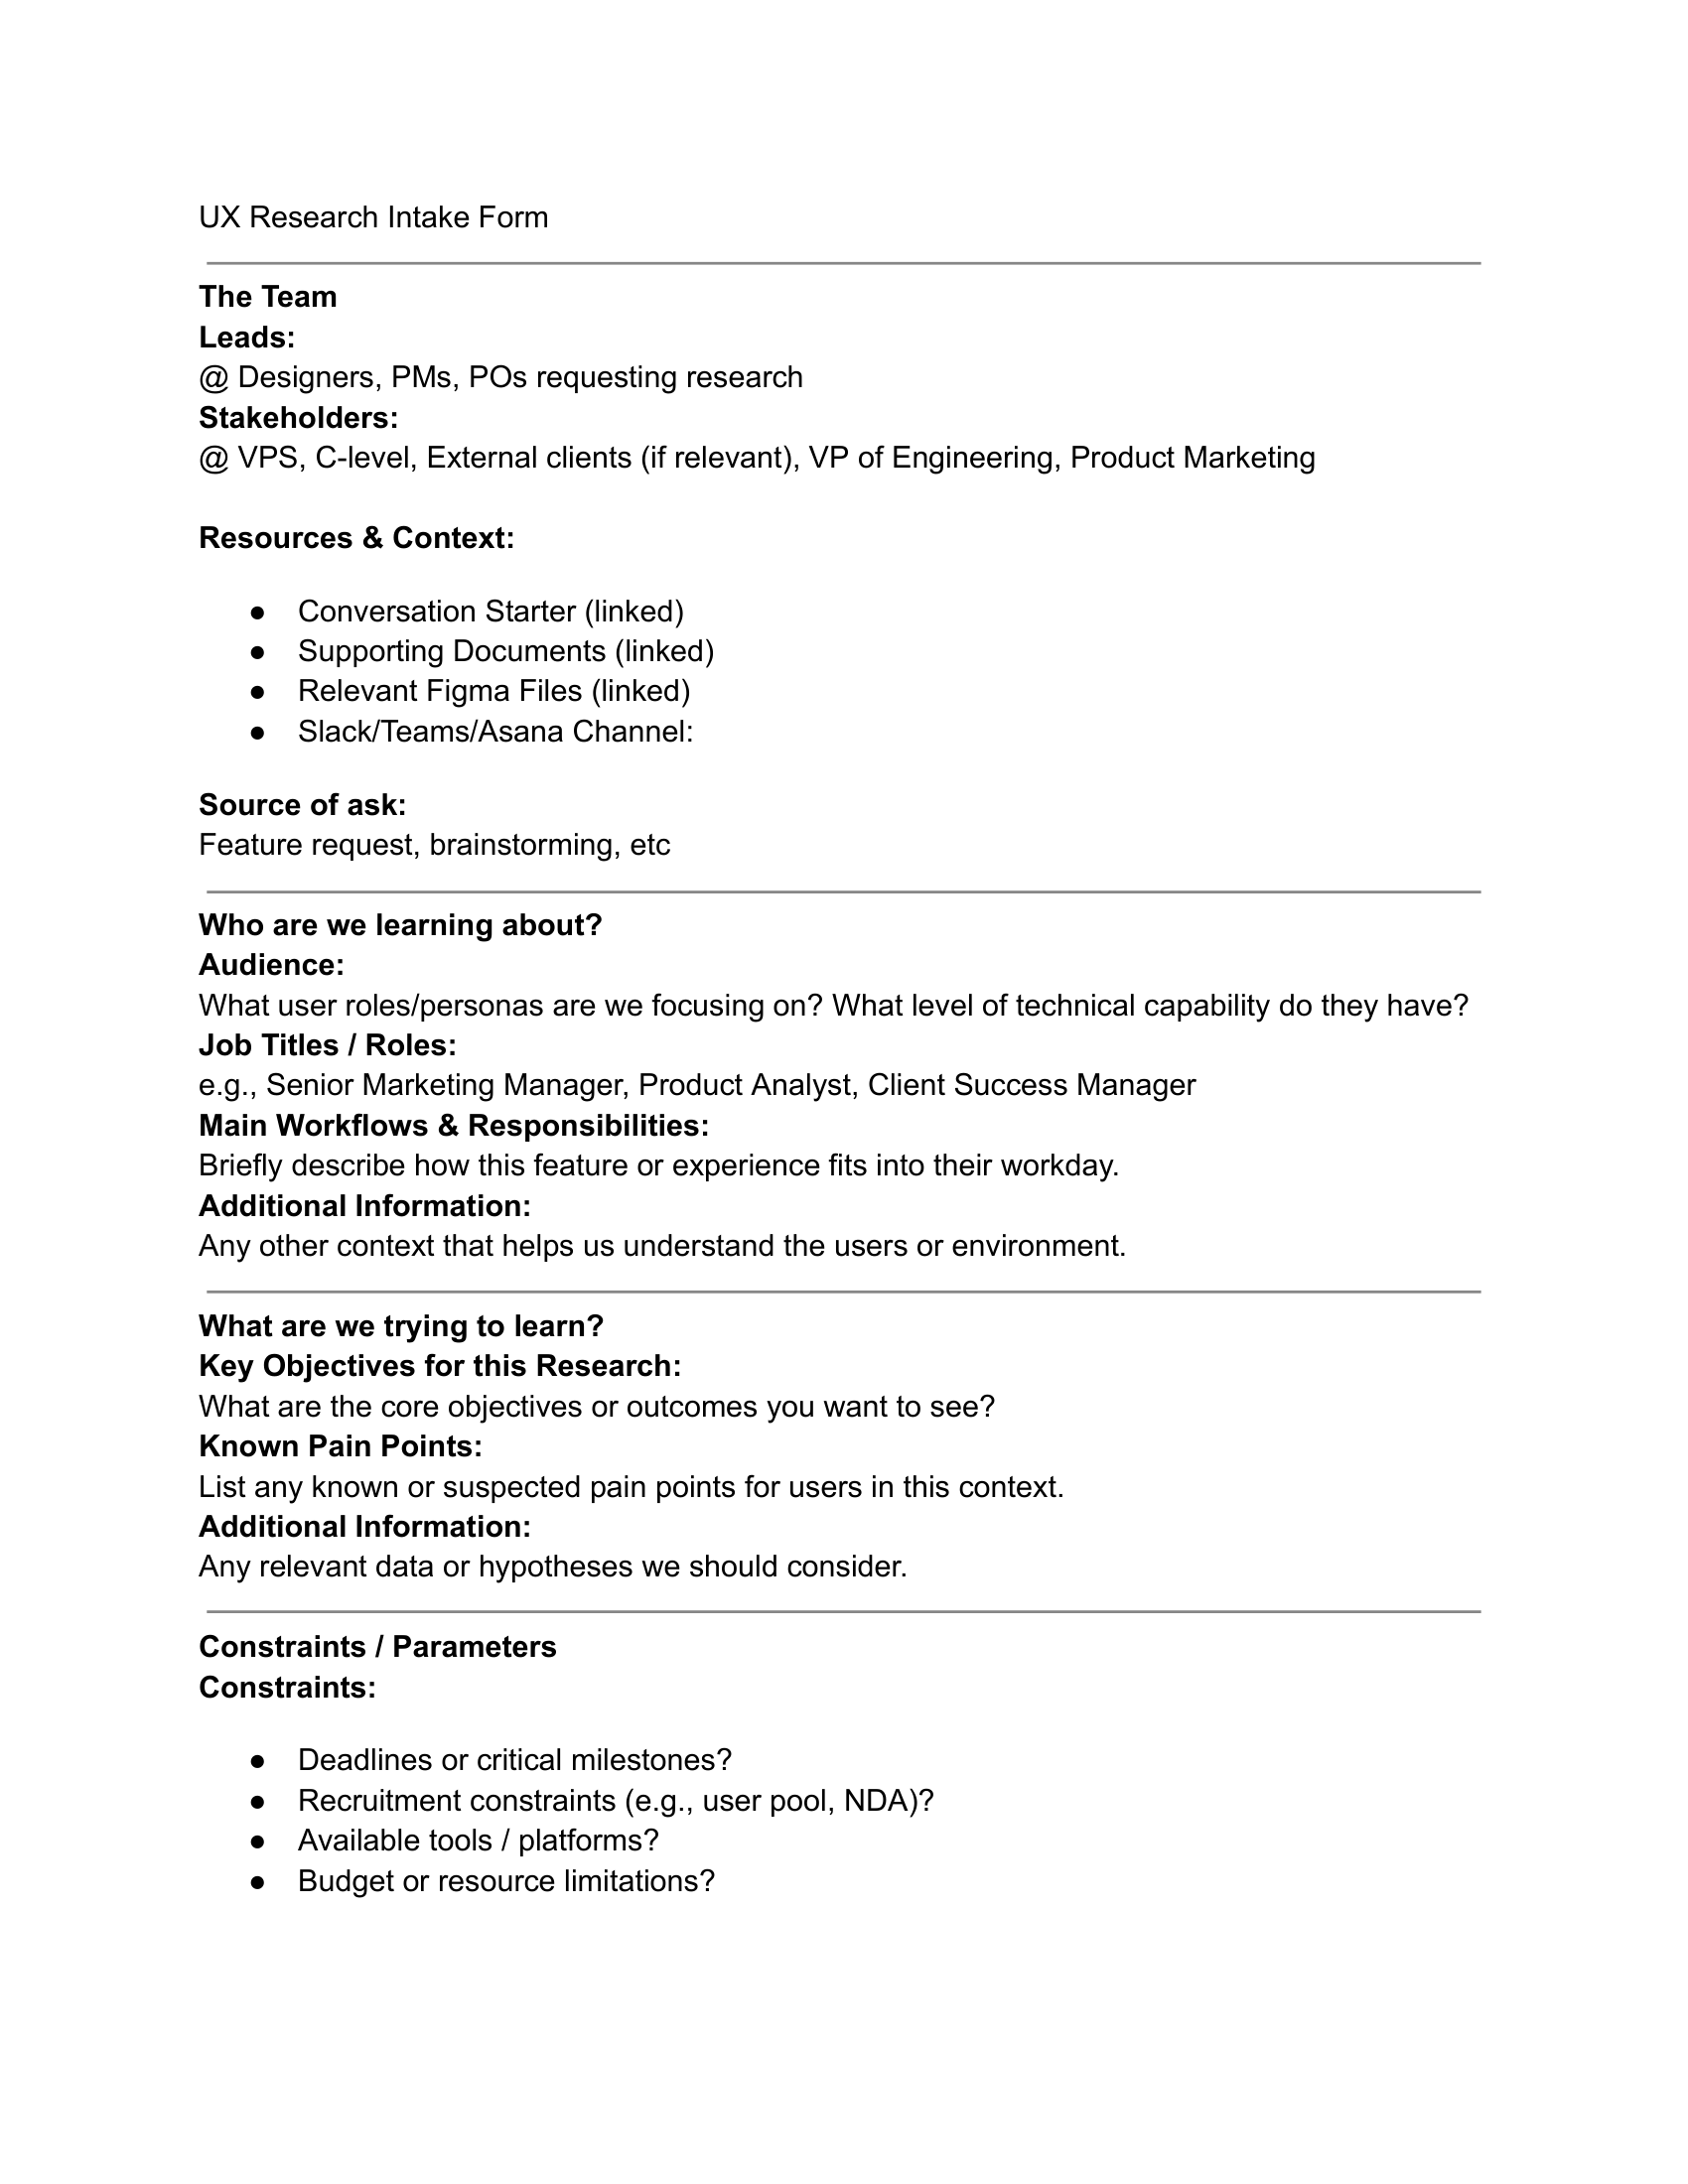
- UX Research Intake Form that standardized research requests and linked each one to Marigold's strategic value pillars. Anyone requesting research had to articulate why it mattered to the business before anything got scheduled.
- Design Brief Template that standardized project initiation with success criteria, stakeholder alignment, and phased milestones. The Sailthru Folders brief for Conde Nast was the first instance, with explicit targets of SUS > 80 and adoption > 20% in the first month. This template is now used by all PMs and POs across the organization, over 15 product people.
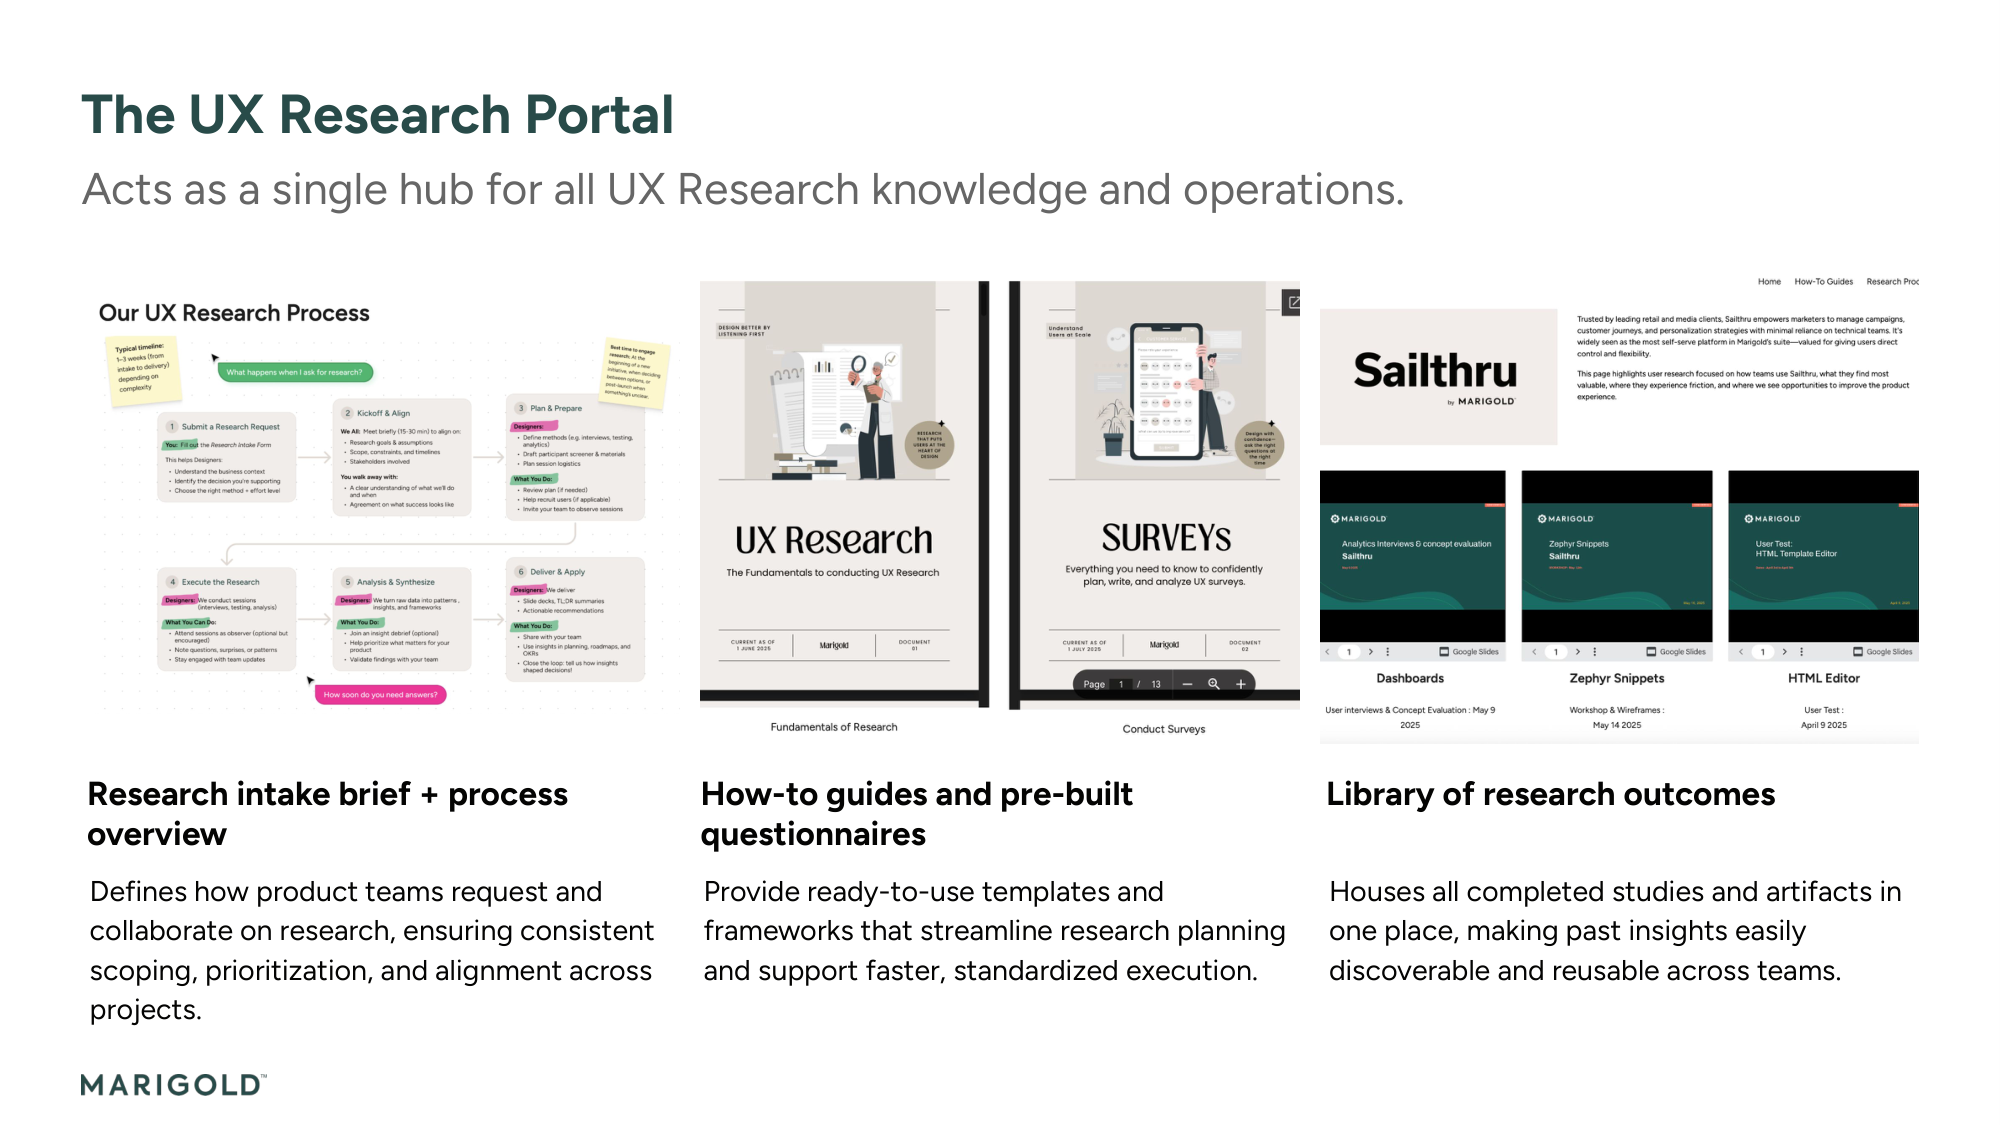
- UX Research Portal on Google Sites as a central hub with how-to guides, methodology references, and a space for each product's research. Product owners and engineering leads can find and read findings independently.
- Research Repository on Glean.ly for searchable insights that persist across projects and team members.
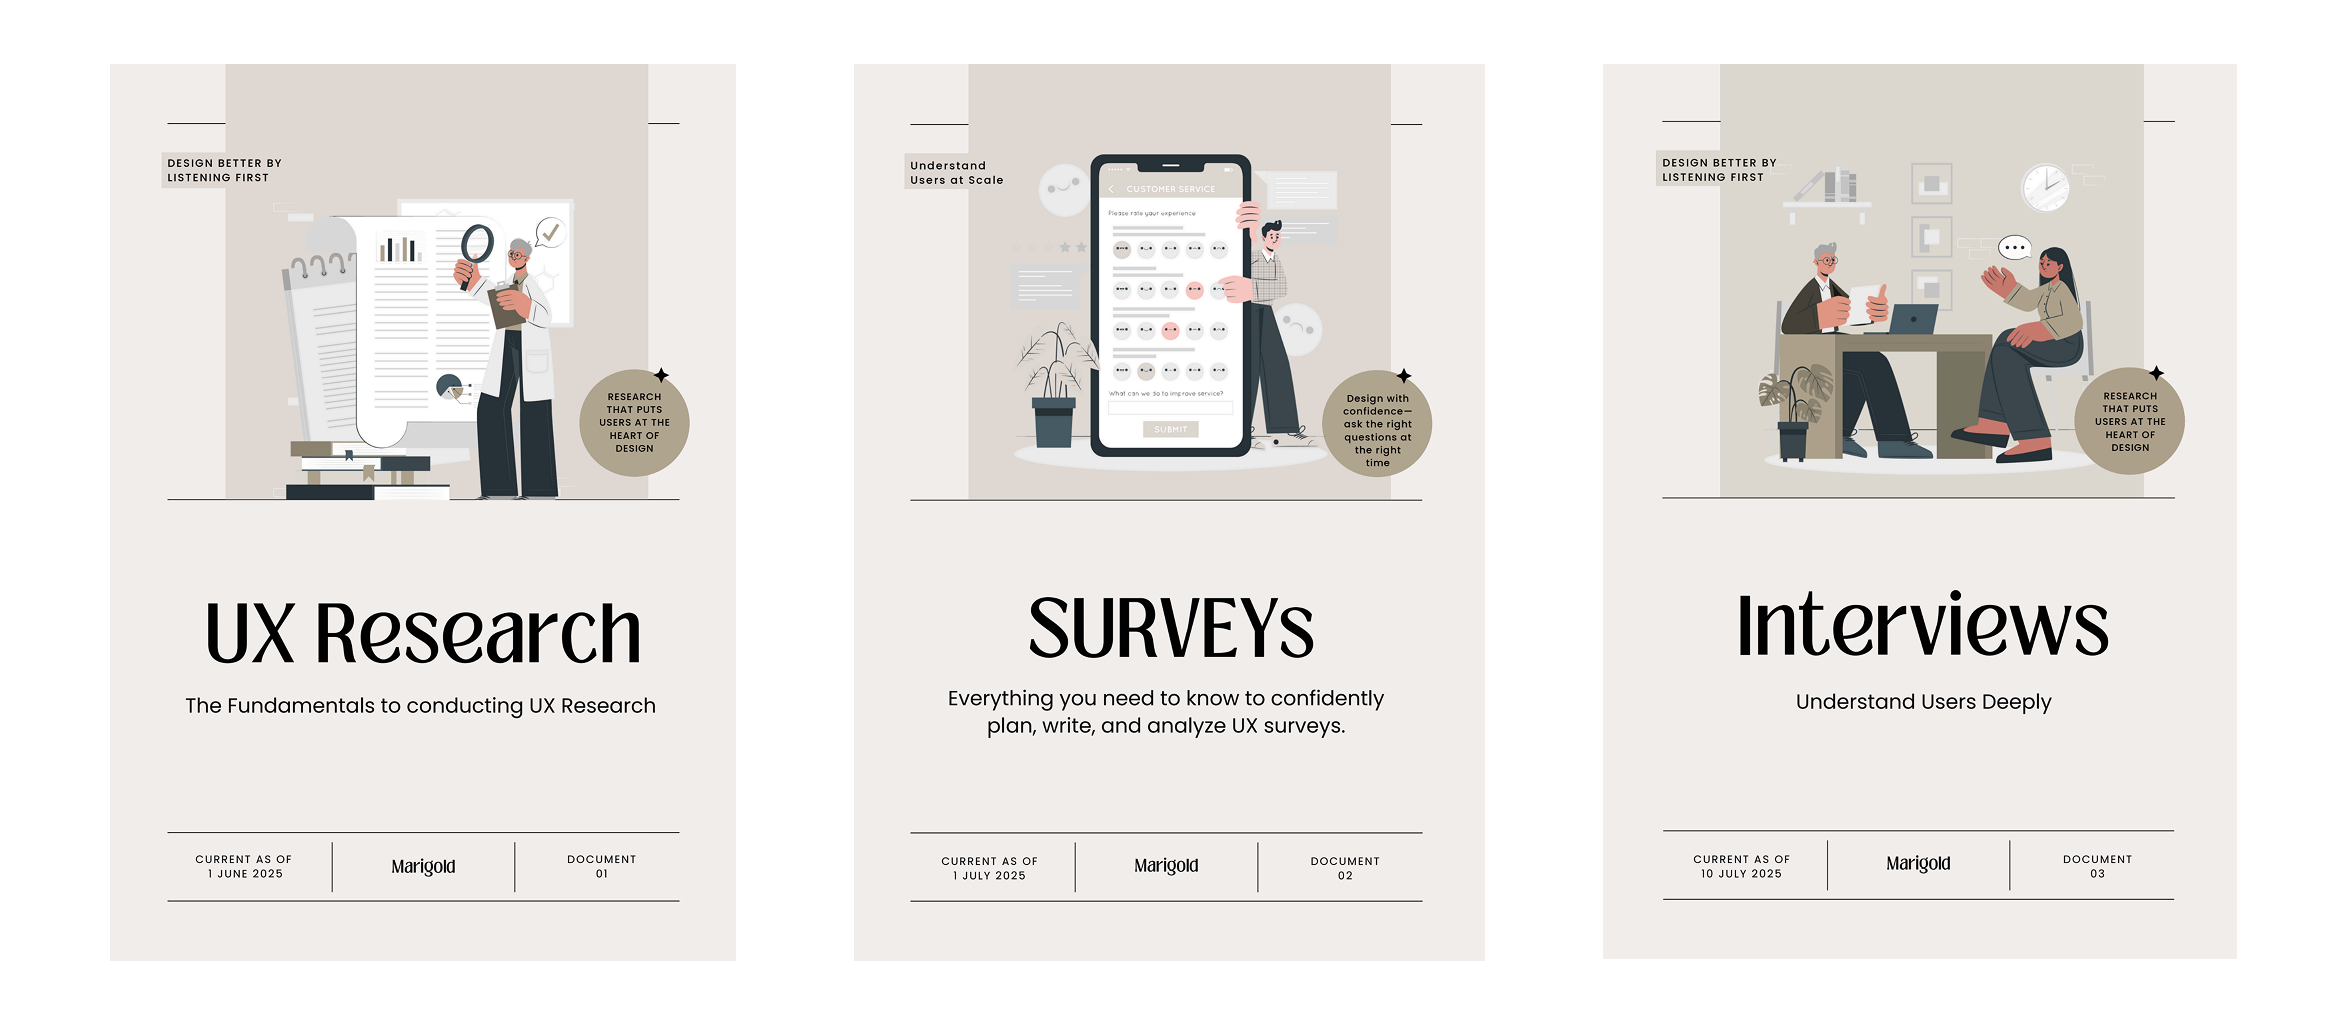
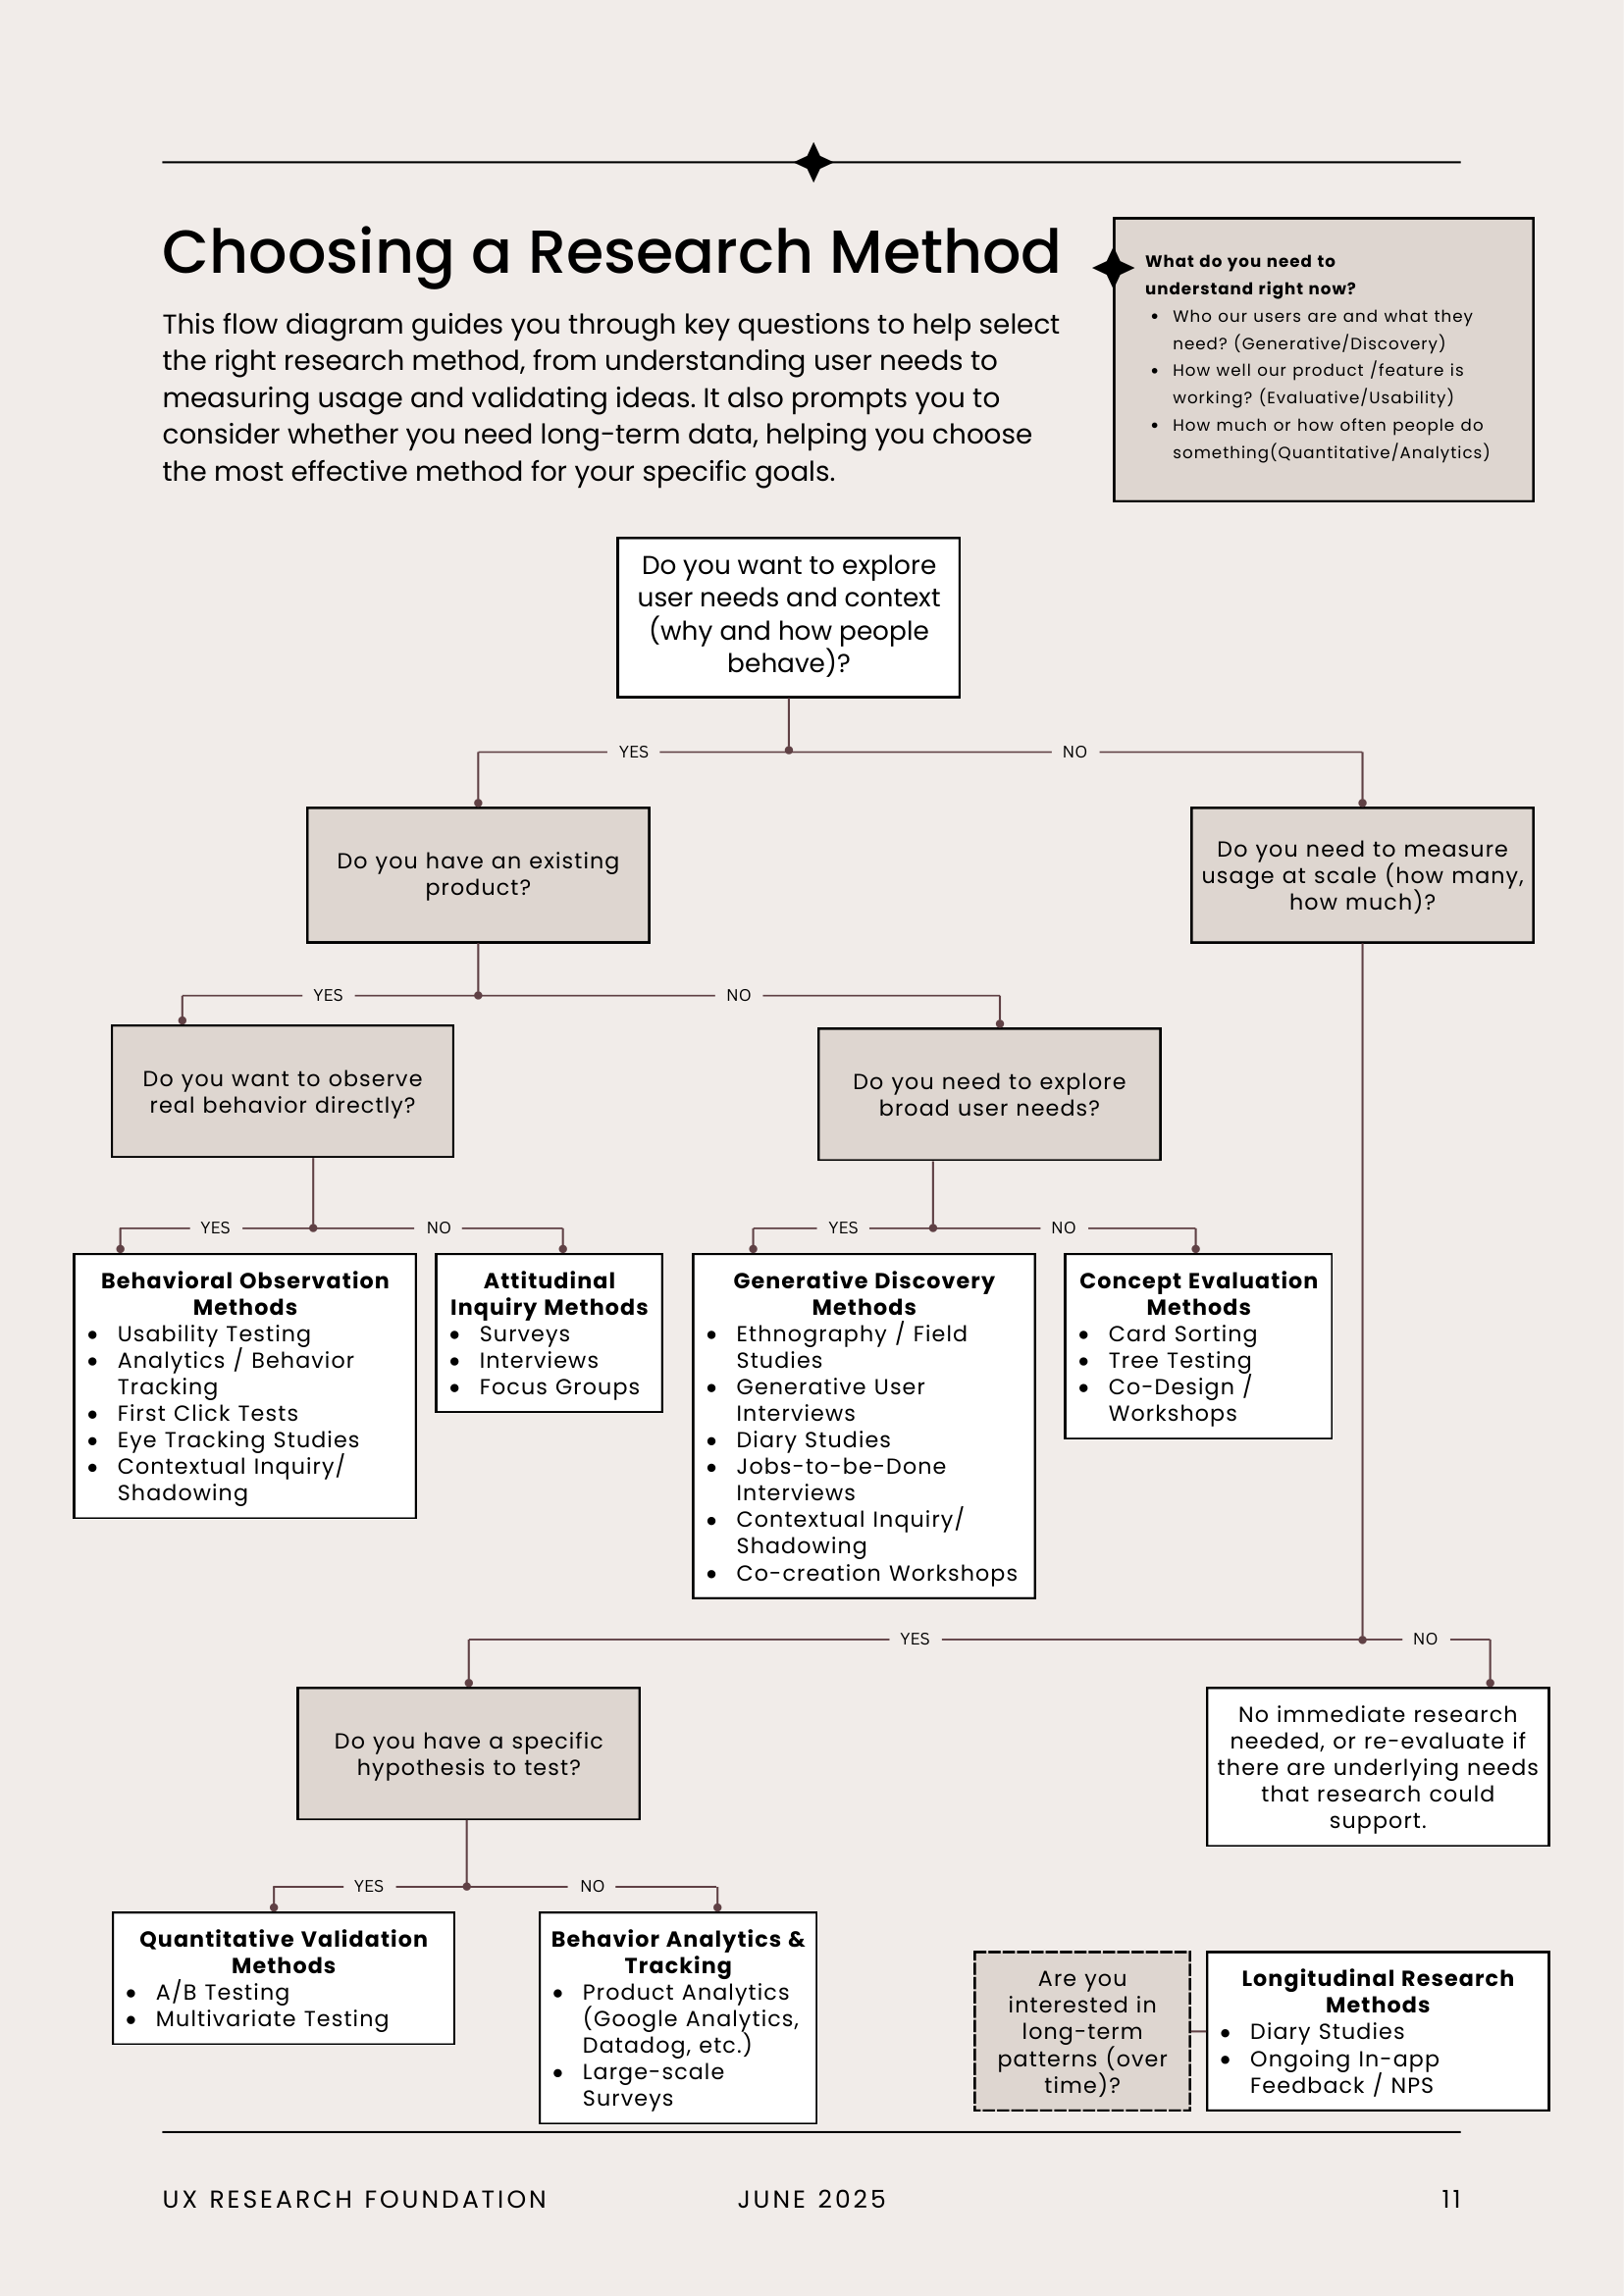
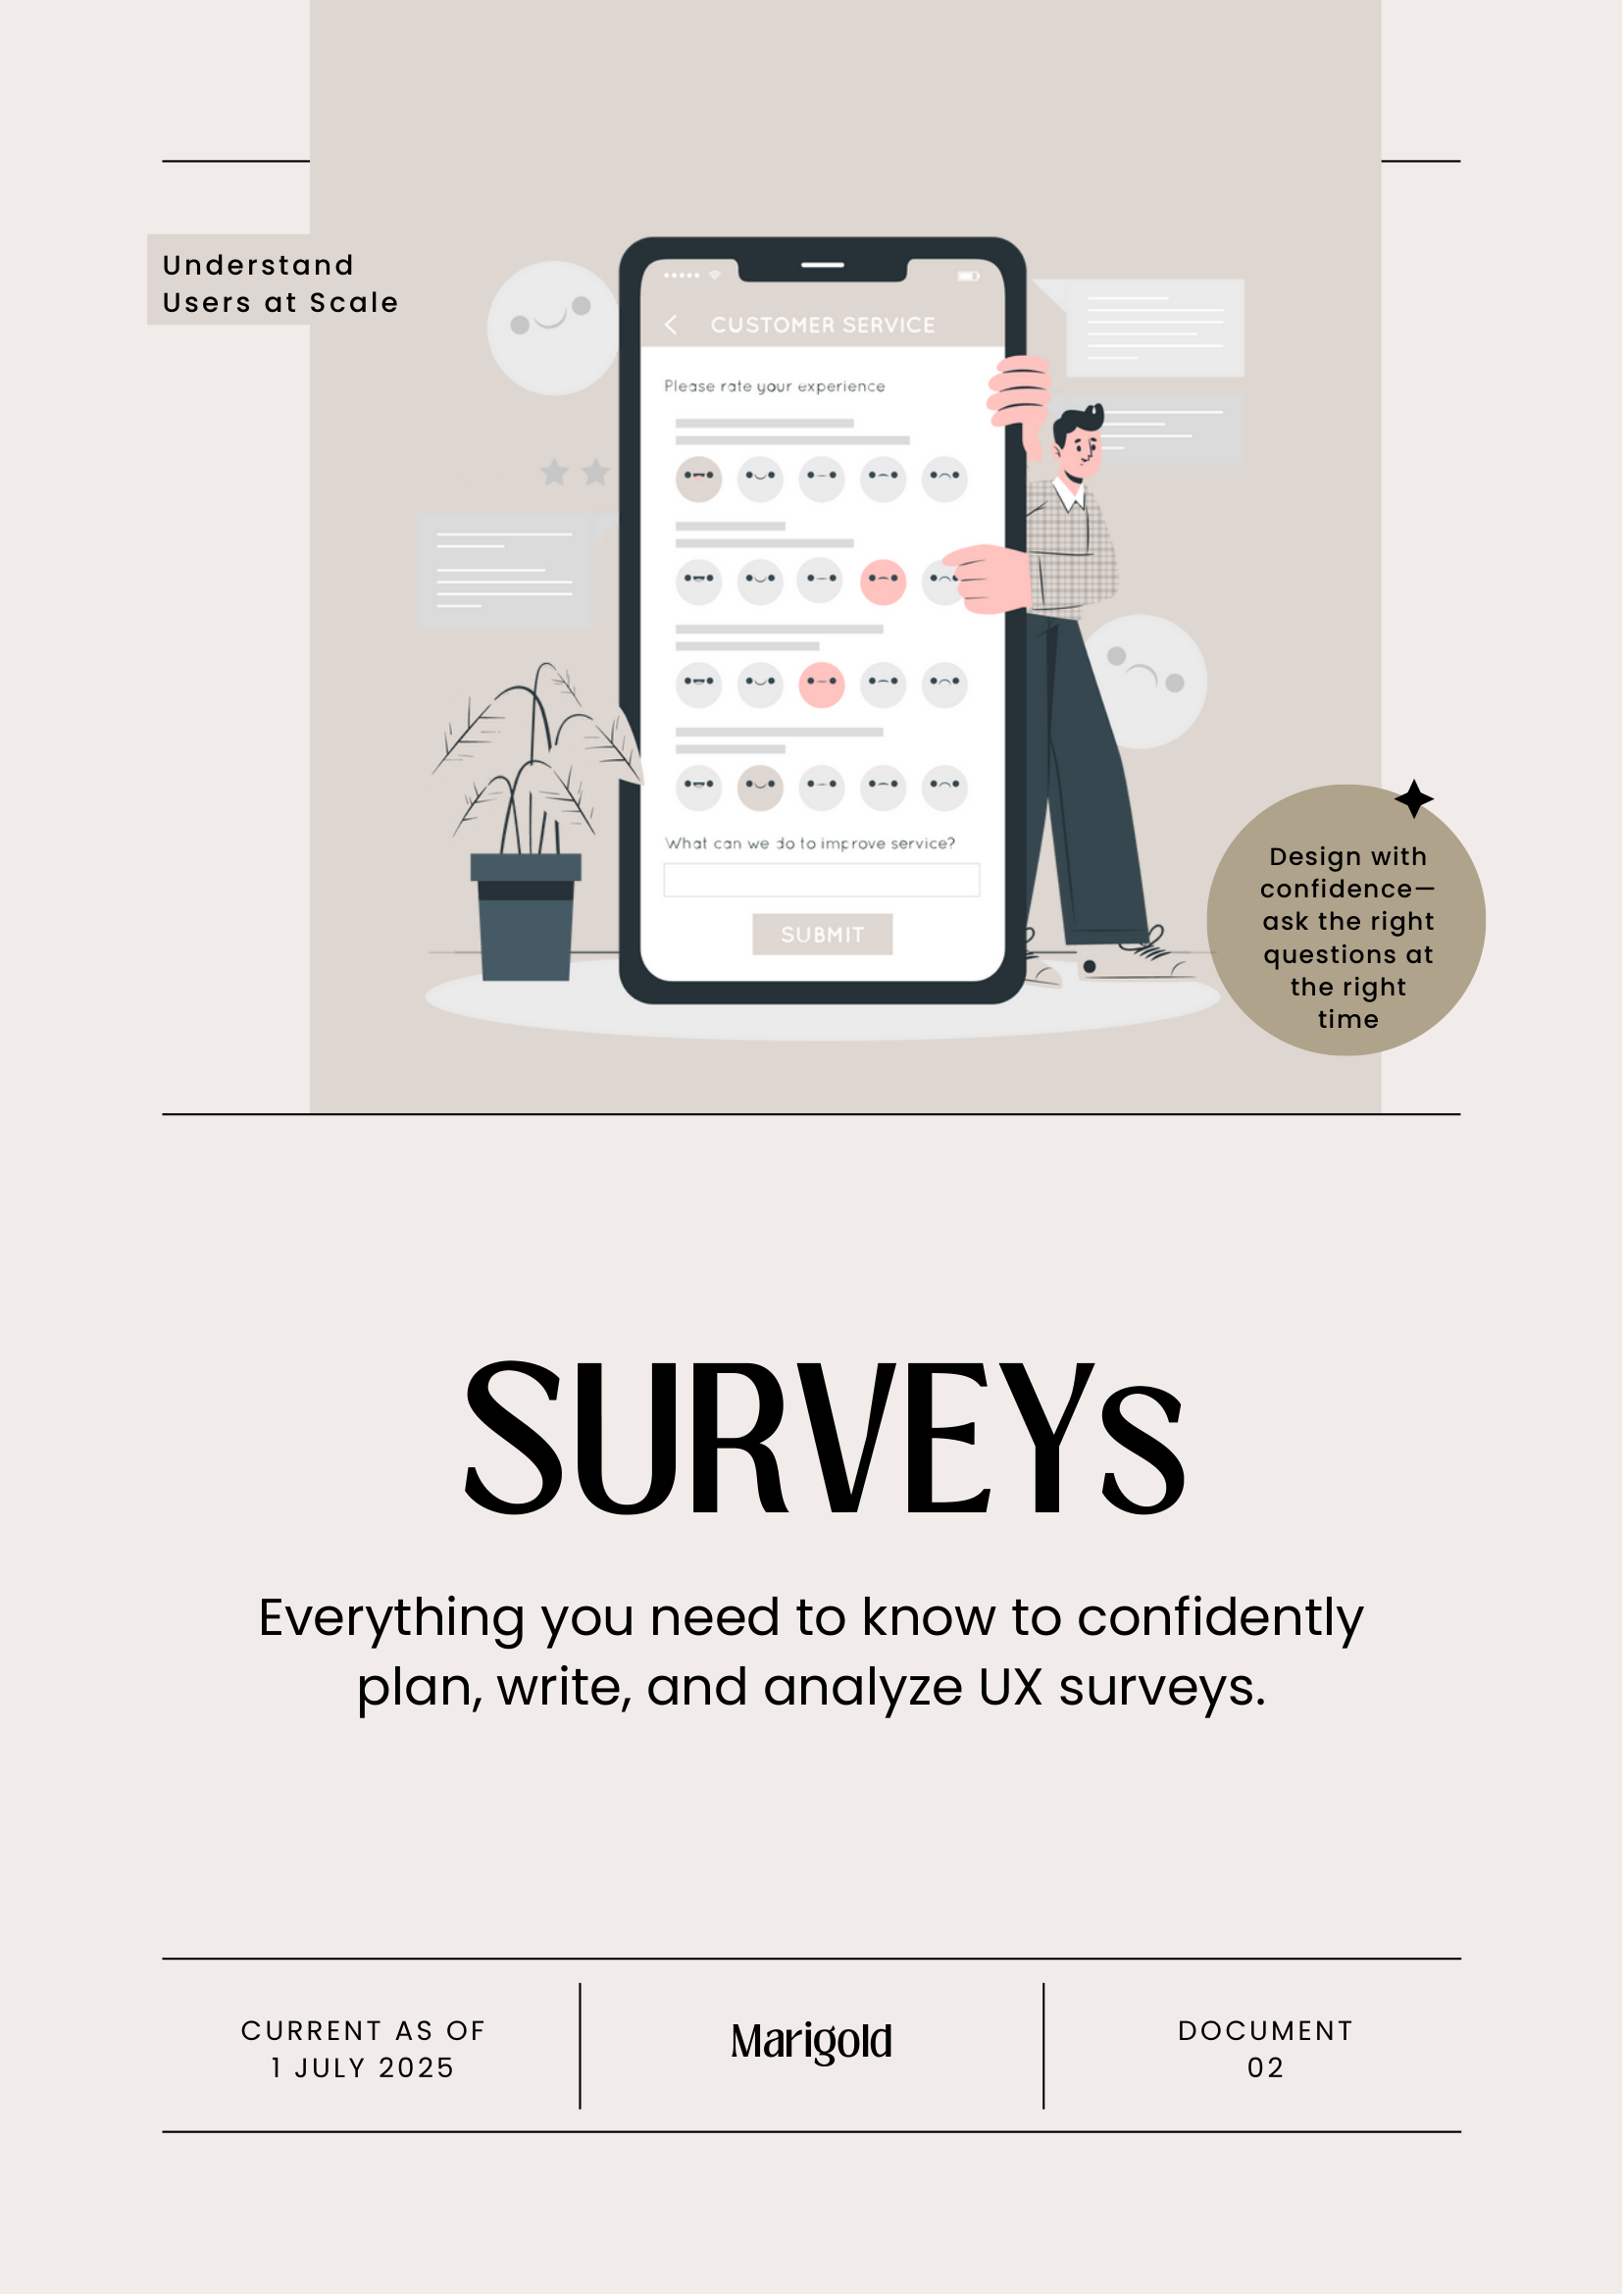
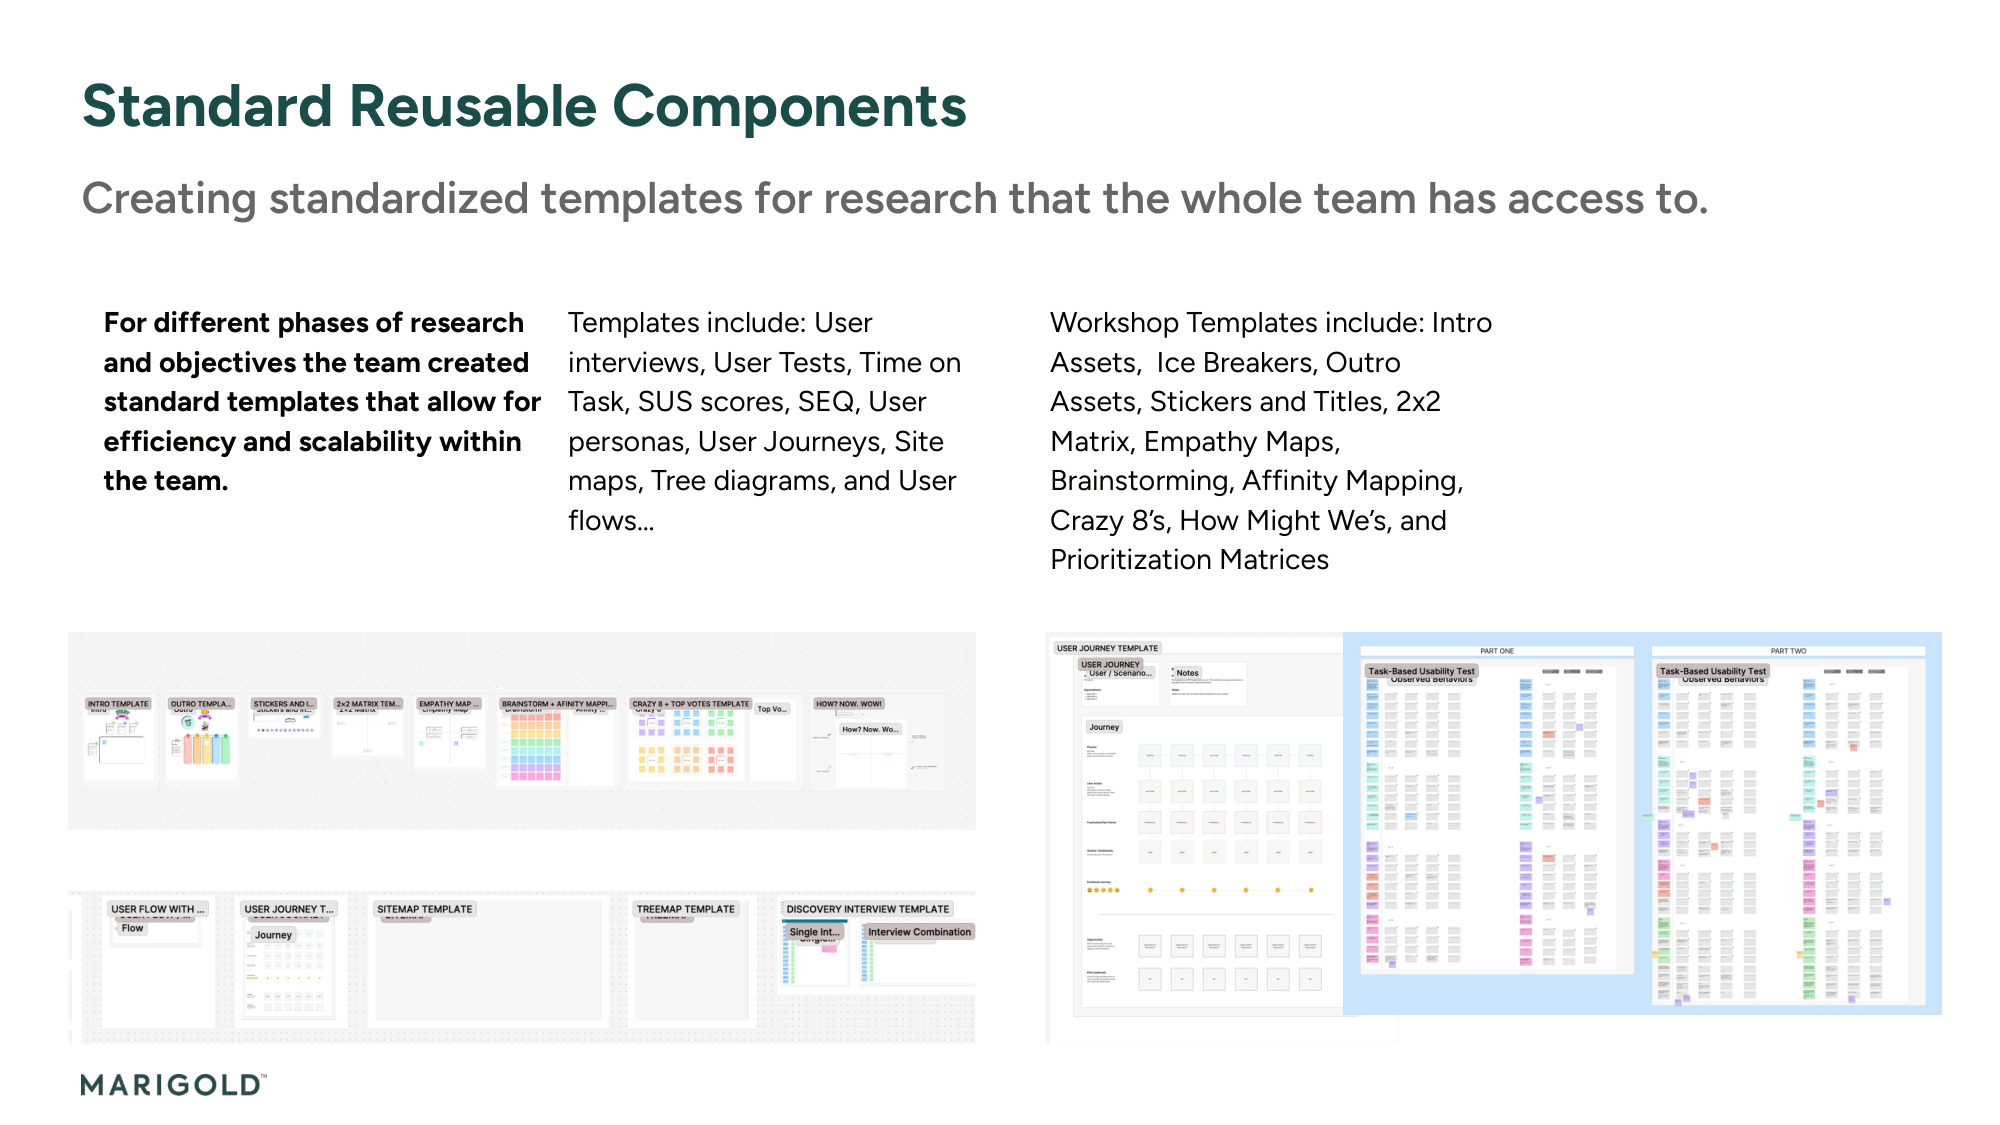
- Methodology Guides as a numbered document series. Document 01: UX Research Fundamentals (14 pages) with a decision tree for method selection and step-by-step protocols. Document 02: Surveys (13 pages) with a 6-phase checklist from objective definition through analysis. Document 03: Discovery Interview Guide, a reusable 30-minute semi-structured protocol now used by POs for their own research. These were designed as self-contained courses so any designer could conduct quality research independently.
- FigJam Template Library with reusable templates for SUS, SEQ, personas, journeys, interviews, and workshops.
- Research Kanban Board for workflow visibility and request tracking.
- Quarterly UX Research Newsletter for distributing key findings across the organization.
All of these are now used independently by the six members of the UX team.
Connecting the Silos
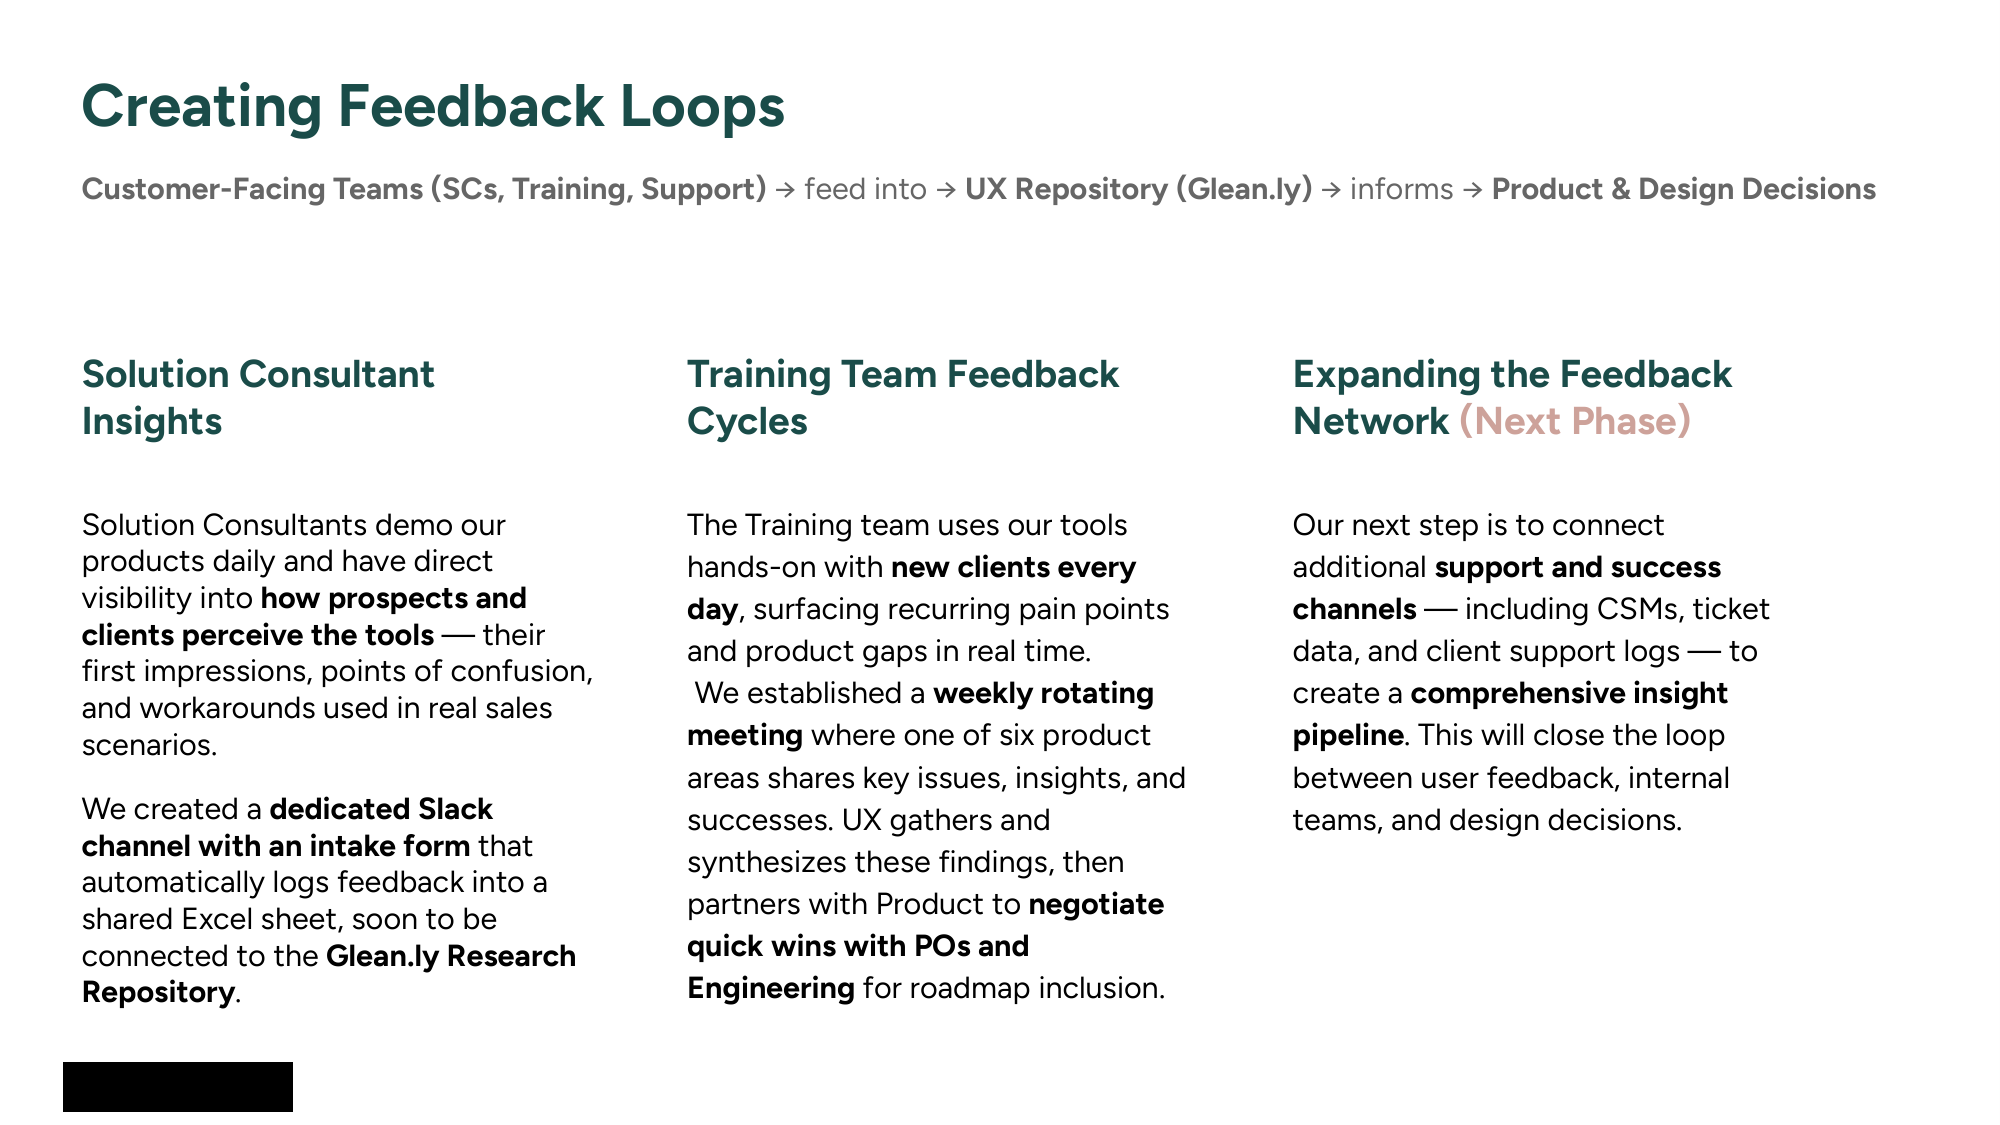
I worked with the VP of Solutions Consulting to create a dedicated Slack channel with a structured intake form. Consultants submit feedback categorized by UX area (navigation, architecture, accessibility, bugs) and linked to business context: which products, revenue impact, how many clients affected. Submissions flow into a shared spreadsheet that I export into Glean.ly for tracking and cross-referencing across products.
With the Training team, I worked with their VP to set up recurring meetings where one representative from each product area presents the UI issues and bugs that users consistently struggle with. I turn these into case decks for the product owners, and we find ways to fit smaller fixes into the roadmap when developers have capacity or fold them into larger initiatives already in progress. These started as weekly meetings and shifted to monthly check-ins with progress tracking as the process matured.
The Research
With the infrastructure in place, I used it. All of the following research was conducted in my first four months.
Loyalty Platform, 60-Page UX Foundation
The most comprehensive of the Foundations. I combined Amplitude analytics, internal interviews across three continents, three updated user personas, journey maps, navigation tree audits, heuristic evaluations, first-time usability testing with five users, competitor benchmarks (Antavo, Capillary, Talon.One), and accessibility scans. First-time user success rates ranged from 20% to 40% across core workflows. Creating an Offer had a 60% failure rate. Segment creation required 29 steps. 81% of all platform views were concentrated on a single page, the Member CSR screen, meaning the platform's advanced features were essentially invisible. This research redirected the Loyalty product roadmap.
Liveclicker, Success Criteria Evaluation
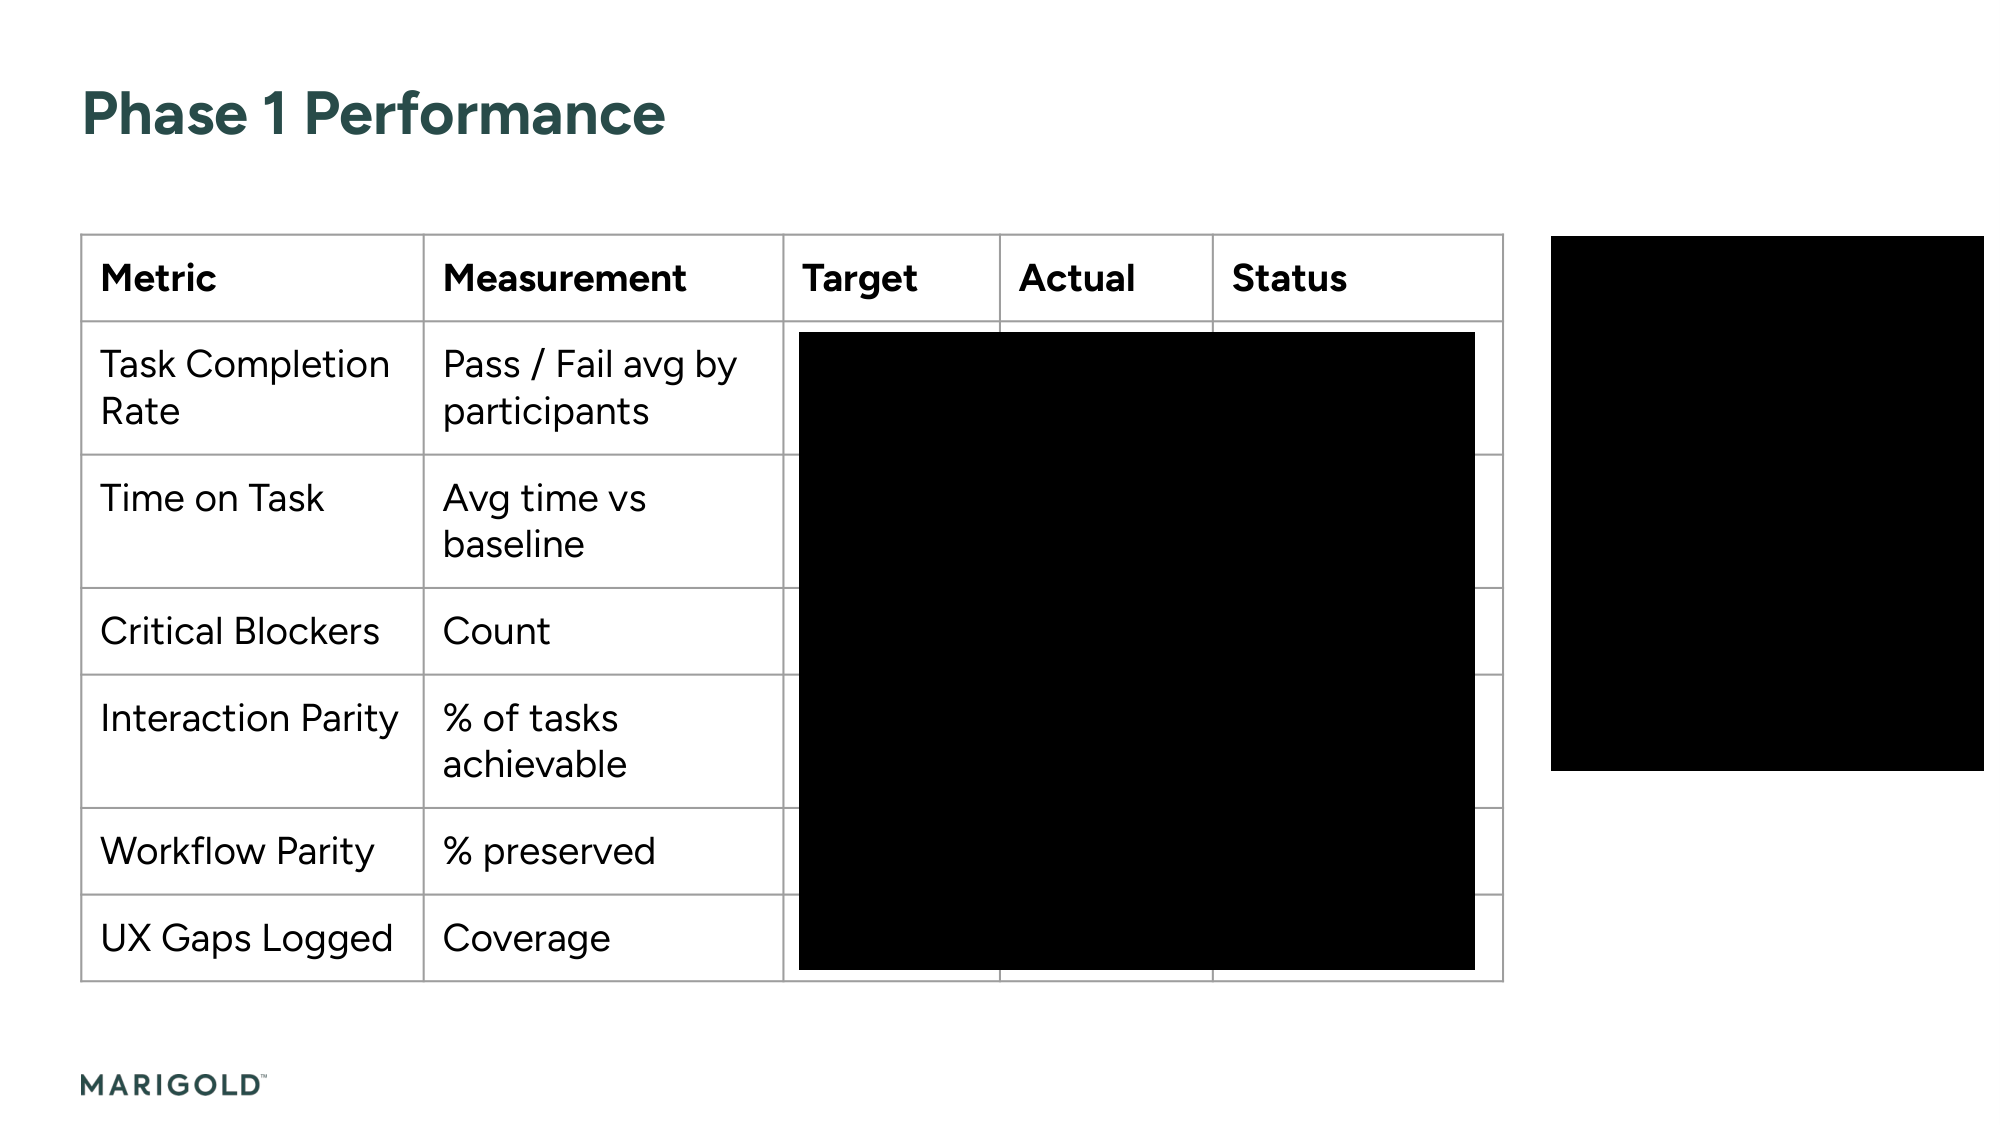
For the NewClicker platform redesign I defined quantified success thresholds before evaluating launch readiness: task completion ≥ 70%, time on task 10–20% faster than baseline, zero critical blockers, interaction parity ≥ 60%, workflow parity ≥ 70%. The prototype achieved 93% task completion but the live implementation fell to 44% due to critical blockers. This evaluation prevented a premature launch and gave Engineering a focused remediation path.
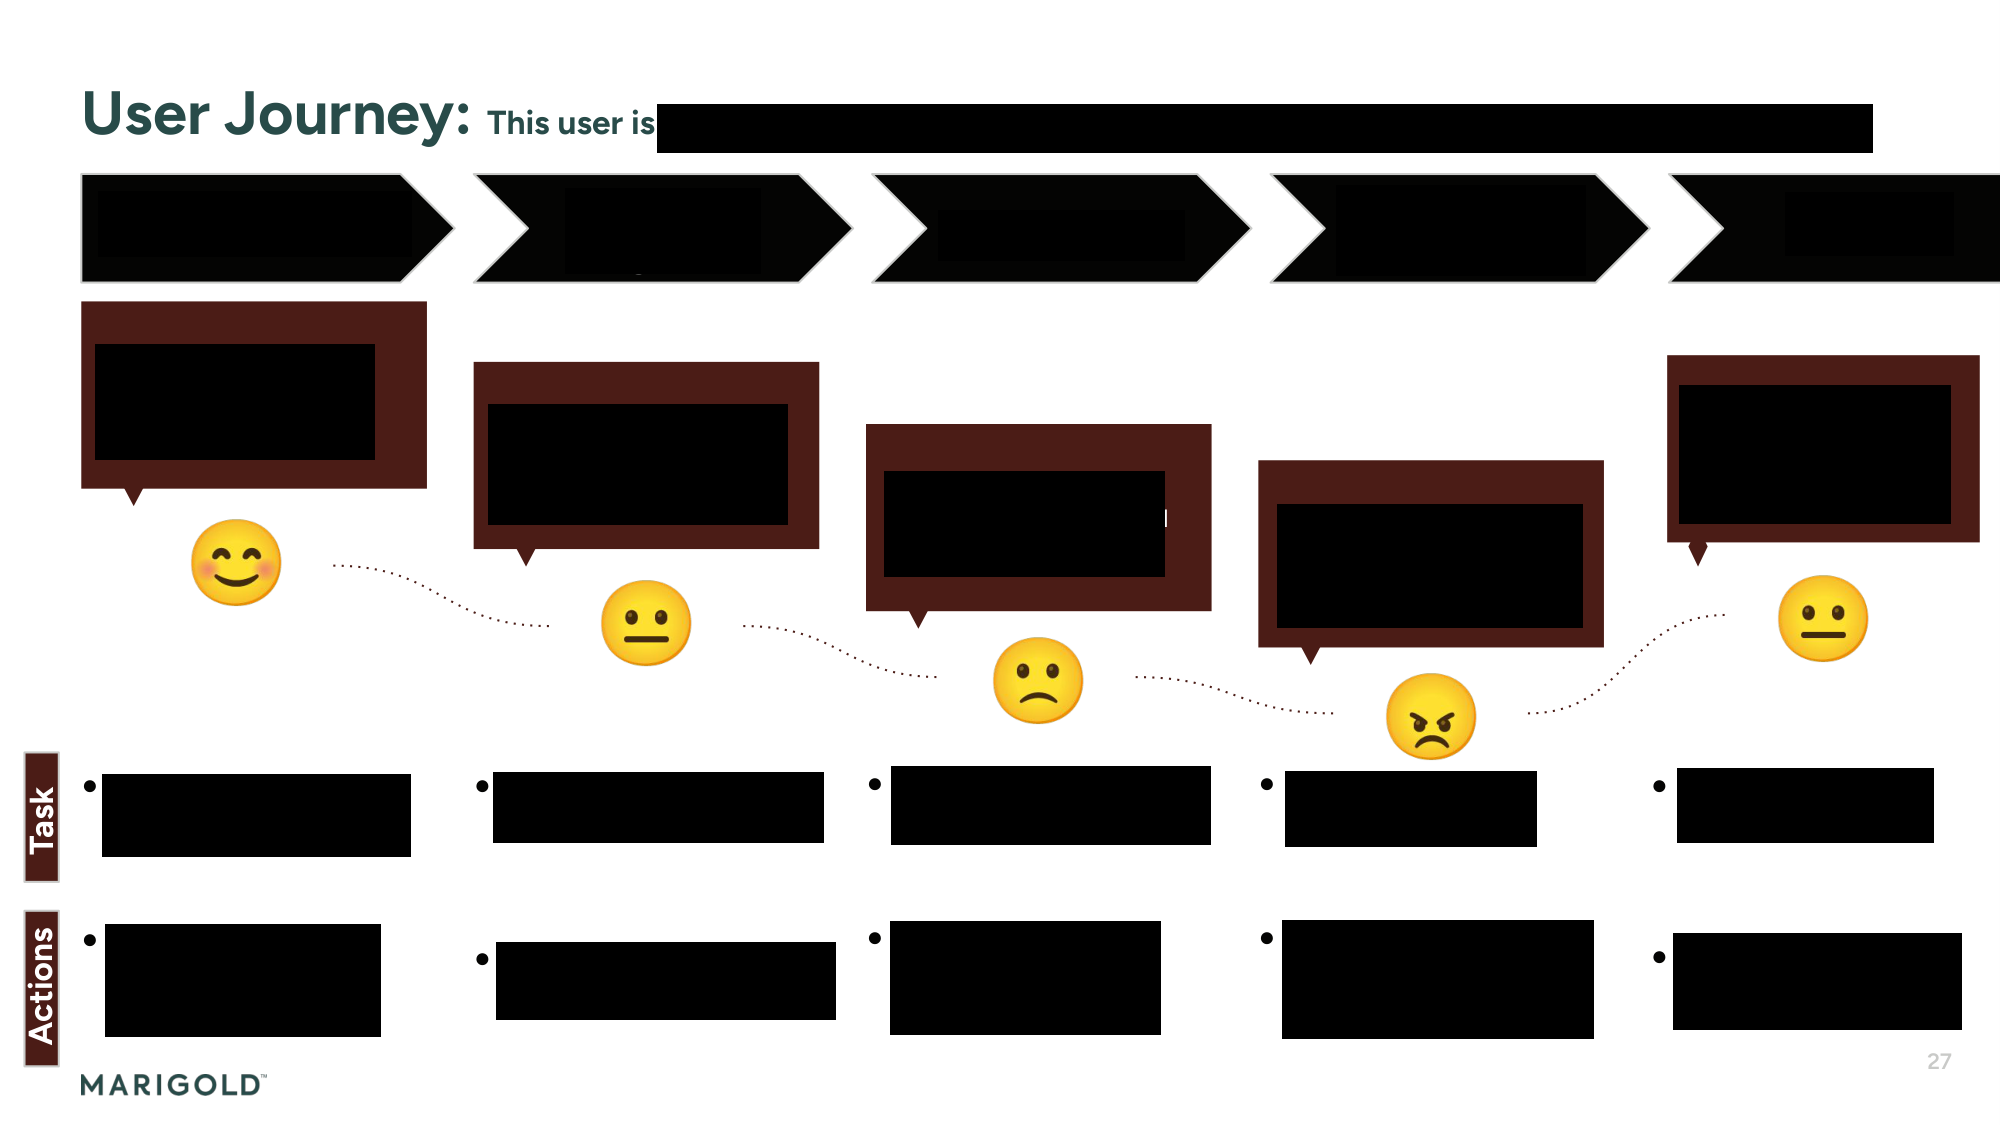
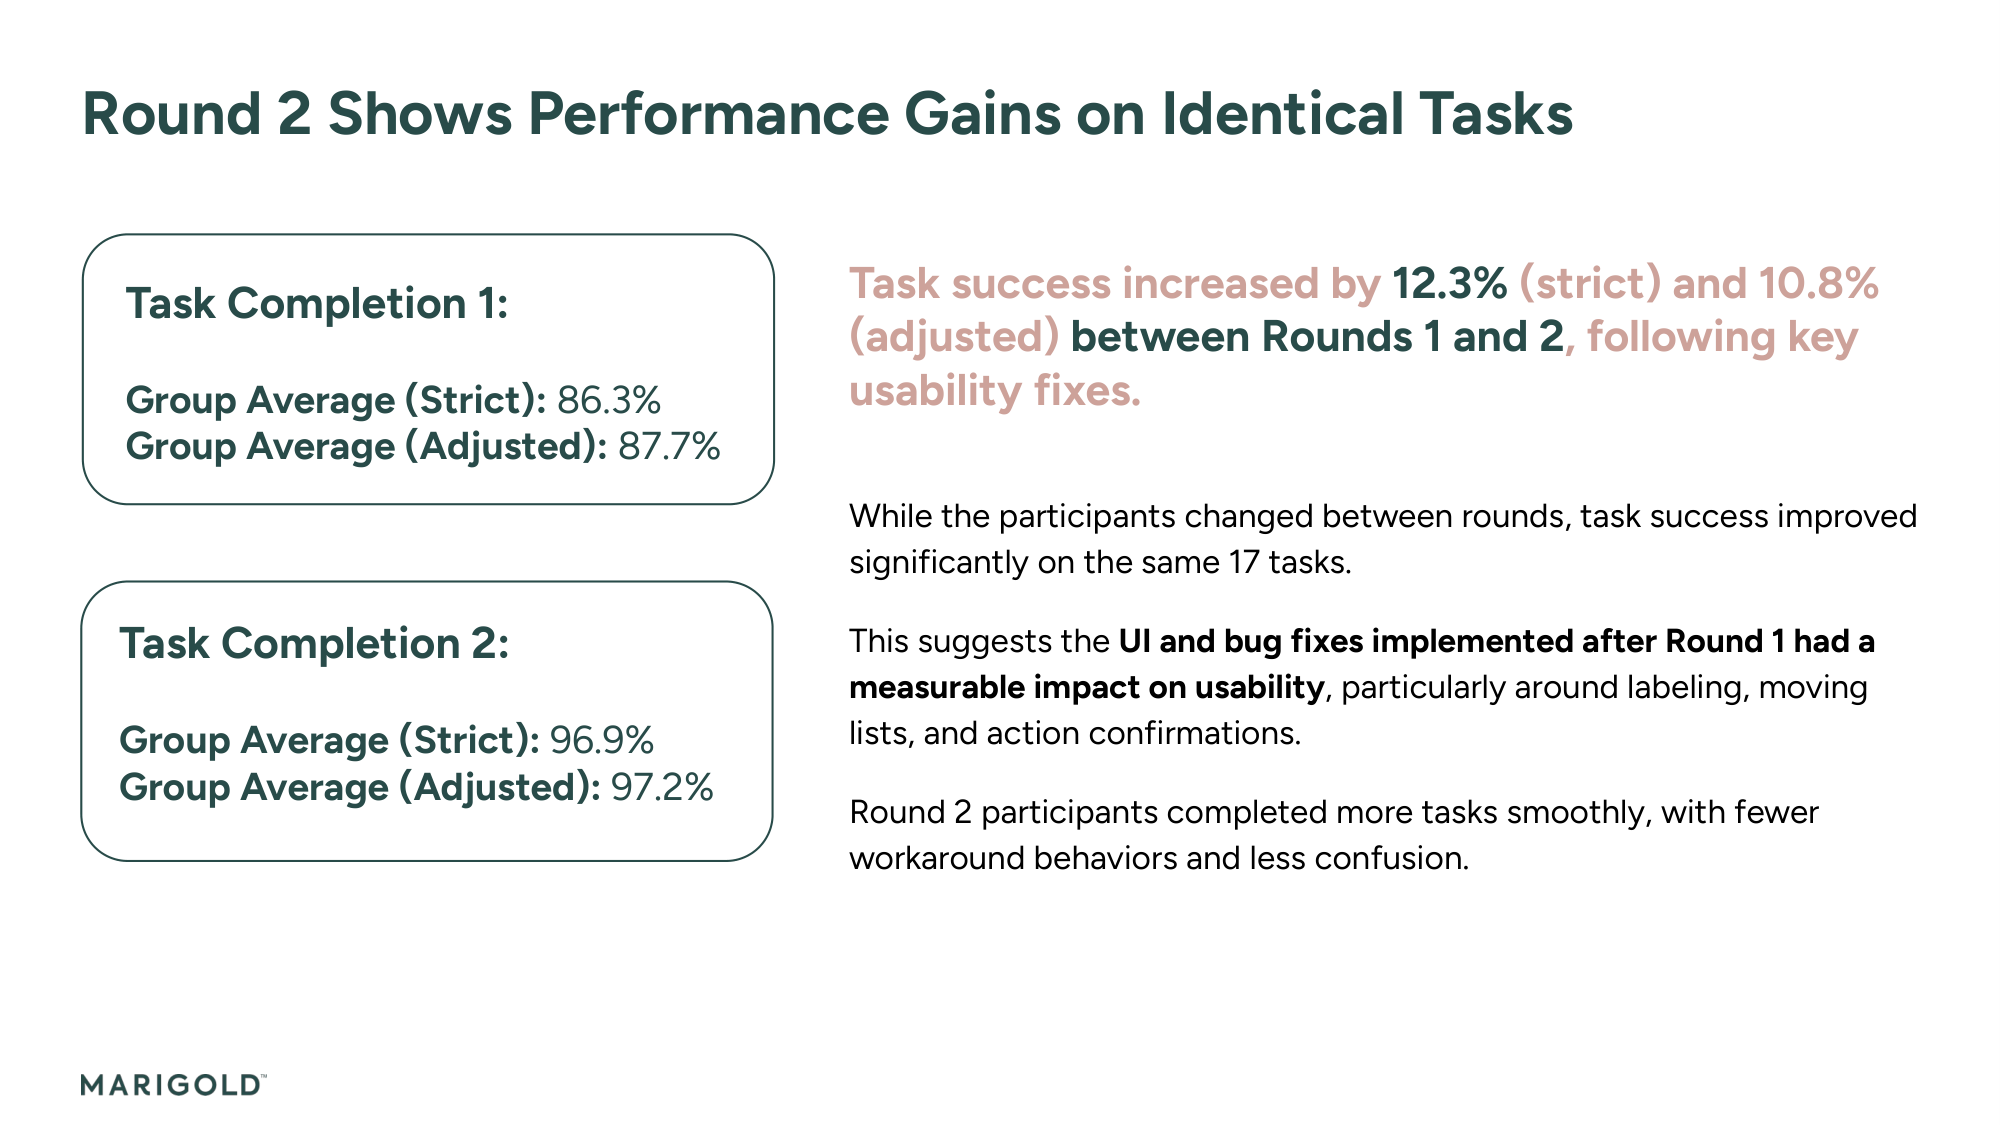
Sailthru Folders, Two Rounds of Usability Testing
For this brand organization feature built for enterprise multi-brand clients like Conde Nast, I ran two rounds of testing with 31 participants across 16 hours of research. Round 1 with 6 internal users established a baseline. After working with Product and Engineering on the critical issues, Round 2 with 6 external users validated the improvements. Task success improved from 86.3% to 96.9% and the feature achieved a SUS score of 90.
Sailthru Analytics
9 user interviews across 2 countries and 3 seniority levels, plus a 29-question survey with 16 respondents across APAC, AMER, and EMEA. Only 31% of users agreed that dashboards "provide value" and 62.5% still relied on legacy reports.
Cross-Product Workshops
8 facilitated workshops including co-creation sessions for Loyalty Program Settings (7 participants, 120 min), Zephyr Snippets redesign (8 participants, 120 min), and cross-product integration workshops bridging Liveclicker with Sailthru, Selligent, and Cheetah Digital.
In total across four months: over 100 users engaged, 45+ hours of direct research, 5 interview studies, 3 structured user tests, and 8 facilitated workshops. This continued beyond the initial four months. Over the full eight months in this role I ran over 20 independent research efforts across different teams and products, ranging from quick usability evaluations to full discovery cycles.
Results
8
Process artifacts built, now used independently by all 6 UX team members
15+
Product managers and POs using the Design Brief template
5
UX Foundations completed across the product portfolio
20+
Independent research efforts conducted over 8 months
The process artifacts, methodology guides, and templates are now used independently by the full UX team. The Design Brief template has been adopted by over 15 product managers and product owners, and POs are running their own discovery interviews using the templates I created. Research progress and standardization were presented to VP and C-level leadership.
Reflections
The infrastructure was the multiplier. When a new research need came up, there was already an intake form to capture it, a methodology guide to plan it, templates to execute it, and a repository to store the findings. The system works because it was designed to scale beyond any single person, and it does.
Key Artifacts
Related Case Studies
See all projectsZeta Global (formerly Marigold)
Leading design through a $325M acquisition
Moved from Senior Product Designer to interim design lead during a $325M acquisition. Team of 6 across 6 products and platform initiatives. Restructured designer assignments by skill and time zone, led a three-phase rebrand across all products, migrated 250+ Figma accounts into the new org, standardized the design process, and ran performance reviews for the CPO. First two rebrand phases shipped by April 2026.
Design LeadershipJellyfish / BrandTech Group
The data platform behind 32,000 advertising accounts
Designed the foundational infrastructure — 400+ screens across 22 data connectors — that powers every product in the Jellyfish suite. 500+ enterprise clients depend on it daily. 8.9/10 usability across three distinct user roles.
Platform Design